- CHAIRMAN’S STATEMENT
- OUR CORE BUSINESSES:
- 1. RICE
- RICE DIVISION
- GEOGRAPHICAL AREAS
- PRINCIPAL BRANDS AND MARKET POSITIONS
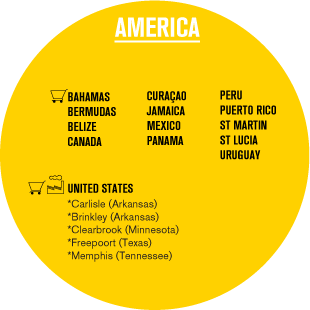
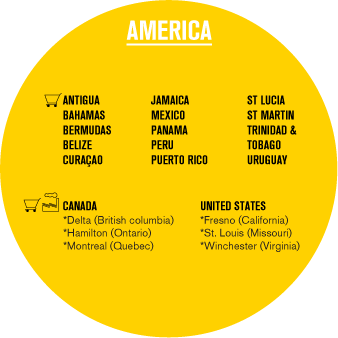
- America
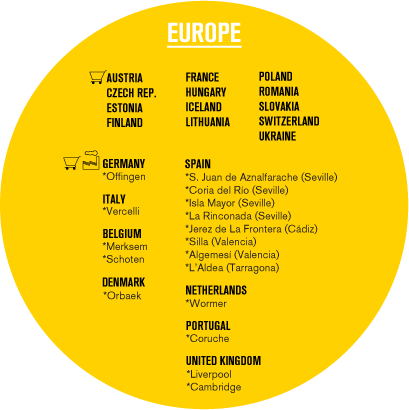
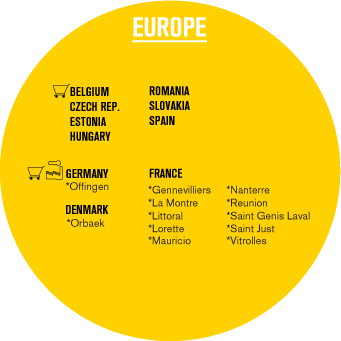
- Europe
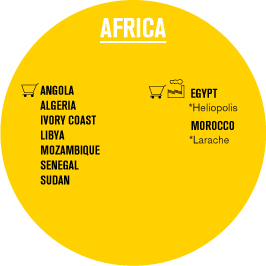
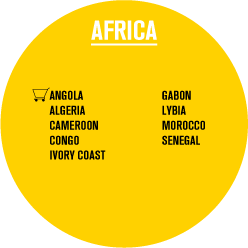
- Africa
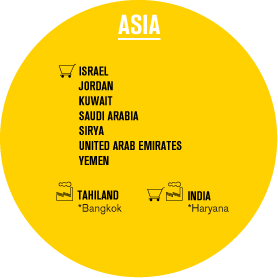
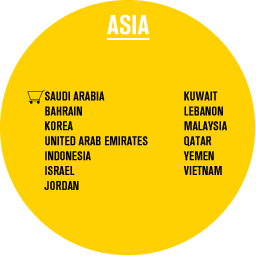
- Asia
- 2. PASTA, SAUCES AND OTHERS
- PASTA DIVISION
- GEOGRAPHICAL AREAS
- PRINCIPAL BRANDS AND MARKET POSITIONS
- America
- Europe
- Africa / Asia
- FINANCIAL HIGLIGHTS
- DISTRIBUTION OF TURNOVER AND EBITDA BY DIVISIONS
- DISTRIBUTION OF TURNOVER AND EBITDA BY GEOGRAPHICAL AREAS
- EBRO FOODS IN FIGURES
- ANALYSIS OF 2013
- SHARE PERFORMANCE

Dear stakeholders:
As you all know, in 2013 we have started to see signs that we might be pulling out of the economic crisis that commenced in 2008. The recession in the eurozone is slowly remitting and the consumer confidence and industrial production indexes closed the year in positive figures, so although growth is still weak the climate is positive.
The situation is also favourable in the USA. Although household income has dropped, there has been a clear improvement in the economic figures (+1.9% annual GDP), including employment, confidence and housing sales.
But this does not mean that the changes observed in our consumers are about to disappear. Those changes appear to be firmly established and consumer streamlining is more than likely here to stay. In general, consumers buy less and more cheaply and are only willing to pay for things that give them a differential value. Consequently, the search for differentiation values is a key element in our company’s growth strategy and in this regard R+D+I was once again a fundamental tool for Ebro in 2013.
In the commodities area, there was an upturn on the grain markets as from July. The announcement of a surplus corn market and a good soft wheat harvest kept prices low up to the end of the year. Durum wheat, with a good harvest and healthy stock levels in Canada, which produces approximately 60% of the world trade of this cereal, also helped to keep prices low. Rice prices remained low with record world harvests and abundant world stock, attentive to the new attempts by Thailand to reduce its government stock. Within this global scenario there are a few especially important exceptions which have represented greater challenges for the Ebro Group during the year, namely the devastating drought in Texas, pressure on domestic prices in the USA, Basmati prices and the shortage of rice at competitive prices from Spain.
The rice division had a bittersweet year, since although the evolution of its brands was satisfactory in both Europe and the United States, with growth in market shares and excellent shelf positioning, it was hard hit by several external factors, as a result of which the satisfactory performance of its brands has not been reflected in its results. These factors were mainly the mass default of basmati supply contracts in India, continuation of the severe drought in Texas and the impaired profit margins in Morocco owing to large-scale smuggling of rice into the country. We have worked hard to implement measures that will help us to minimise the impact of these factors on our future business development.
The pasta division, in contrast, had a good year, with stable durum wheat prices and the first signs of benefits deriving from the change of strategy implemented in the United States in the second half of 2012. In Europe, in a scenario strongly influenced by the growth of private label brands and constant promotions by our rivals, our brands have managed to maintain both market shares and profitability. In the United States, margins have begun to pick up and new gluten-free products and sauces launched in Canada went down well with consumers.
On an international level, we brought to fruition three inorganic growth projects. The largest project was the acquisition of Olivieri, leader in fresh pasta and sauces in Canada, with market shares of 51% and 41%, respectively. This operation was strategically important because it gave us a foothold in the fresh foods segment in Canada through the leading brand and, consequently, confirmed our leadership in all the categories in which we operate in that country.
Another project was the purchase of a modern rice plant in India with a processing capacity of over 100,000 tonnes a year. Through this purchase we will become firmly established in the largest basmati rice producing region in the world, guaranteeing supplies of this variety for all our subsidiaries. At the same time, we will enter a vast domestic market with high growth rates, where we will be able to progressively introduce our broad array of sauces, rice and pasta products.
Finally, we also bought a 25% stake in the Italian company Riso Scotti, leader of risotto rice in Italy. With this investment of €18 million we aim to begin a project for the international development of the risotto market. Scotti is the most prestigious brand in this area, with the added “authentication” feature of being made in Italy. Italian food has enormous potential and Ebro has put its money on its globalisation capacity.
But it hasn’t all been growth. Within our current Strategic Plan, we also announced that we were pulling out of our pasta business in Germany, as we found that the German market neither fitted in with the Group’s strategic target nor matched the yield achieved by our other businesses.
On the stock market, the value of the EBRO share rose by 17.9% over the year. In the same period Ibex 35 rose 21.4%, Ibex Med 52%, Ibex Small 44.2% and Eurostoxx Food and Beverage, benchmark for European food sector shares, just 7%. We could say, therefore, that EBRO had a rather moderate stock market performance in comparison with its benchmark indexes.
In short, although the consolidated results were dented by all the external factors that have hampered the rice division, the overall balance and evolution of Ebro during 2013 were very positive, since in a sector increasingly dominated by private label, its brands have hung on to their leading positions through intense work in innovation, commercial and marketing aspects.
I invite you to consult the Report and read about the company’s performance in all its areas of activity during 2013.
Antonio Hernández Callejas
Ebro Foods Chairman
The core businesses of
Ebro Foods are rice and pasta.
Within these businesses, Ebro develops its
business model using the different technologies
available: dry, fresh, pre-cooked and frozen.

This is the business area in which the Group is world leader. The business began in Spain back in 1950 and as from 1986 it began its international expansion by purchasing leading brands and companies in Europe, USA and Canada. Now also present in Africa and Asia, the division has an extensive portfolio of leading brands and products. This division accounts for 54% of Ebro’s total sales.

Bahamas
Blue Ribbon®
Mahatma®
Belize
Mahatma®
Canada
Minute®
Curaçao
Blue Ribbon®
Mahatma®
Jamaica
Blue Ribbon®
Mahatma®
Mexico
SOS®
Panama
Blue Ribbon®
Mahatma®
Puerto Rico
Cinta azul®
El Mago®
Mahatma®
Sello Rojo®
SOS®
St Martin
Mahatma®
St Lucia
Mahatma®
United States
Adolphus®
Blue Ribbon®
Carolina®
Comet®
Gourmet House®
Mahatma®
Minute®
River®
Success Rice®
Watermaid®
Wonder®
Uruguay
Minute®
Success Rice®
| SIGNIFICANT MARKET POSITION | SHORT GRAIN RICE |
| CANADA | 1 |
| PUERTO RICO | 3 |
| UNITED STATES | 1 |
Austria
Königs®
Oryza®
Reis-fit®
Belgium
Bosto®
Boss®
Casi®
Czech Republic
SOS®
Estonia
Bosto®
Finland
Risella®
France
Lustucru®
Taureau Ailé®
Slovakia
SOS®
Spain
Arroz Rocío®
Brillante®
La Cigala®
La Fallera®
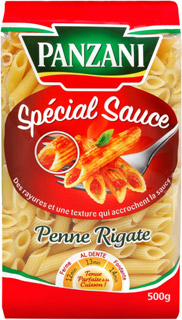
Panzani®
SOS®
Sundari®
Switzerland
Oryza®
United Kingdom
Chinatown®
Double Phoenix®
Gourmet House®
Peacock®
Success®
Sunrich®
| SIGNIFICANT MARKET POSITION | SHORT GRAIN RICE | RETAIL CHANNEL |
| FRANCE | 1 | |
| HUNGARY | 1 | |
| PORTUGAL | 1 | |
| SLOVAKIA | 1 | 3 |
| SPAIN | 1 |
Morocco
Arroz Cigala®
Cup Riz®
Miura®
Mozambique
Arroz Cigala®
Cup Riz®
Miura®
Senegal
SOS®
Sudan
Abu Bint®
| SIGNIFICANT MARKET POSITION | SHORT GRAIN RICE |
| ANGOLA | 3 |
| ALGERIA | 2V |
| LIBYA | LY |
| MOROCCO | 1 |
| V: Market position by value LY: Control retail market SOS, Herba y Abu Bint | |
This division is represented by the companies New World Pasta (leader in USA and Canada) and Panzani (no. 1 in France in the dry and fresh pasta sectors, sauces, couscous and semolina). Apart from these countries, the Group brands are also present in other geographical areas, such as Belgium, Hungary, United Kingdom, Algeria, United Arab Emirates, Czech Republic and Russia, so in just eight years Ebro has positioned itself as the second pasta manufacturer in the world. This division currently accounts for 46% of the Group’s total business.
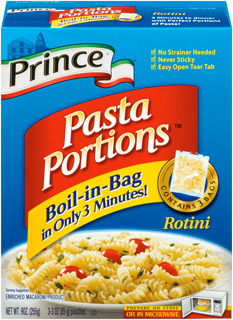
Antigua
Prince®
Bahamas
Ronzoni®
Belize
Ronzoni®
Canada
Catelli®
Catelly Healthy Harvest®
Giovanni Panzani®
Lancia®
Splendor®
Ronzoni®
Olivieri®
Curaçao
Ronzoni®
Jamaica
Ronzoni®
Mexico
Panzani®
Panama
Creamette®
Ronzoni®
Peru
Ronzoni®
St Martin
Ronzoni®
St Lucia
Ronzoni®
Trinidad & Tobago
Ronzoni®
Uruguay
Ronzoni®
United States
American Beauty®
Creamette®
Light´n´fluffy®
No Yolks®
Prince®
P&R®
Ronzoni Healthy Harvest®
Ronzoni®
San Giorgio®
Skinner®
Wacky Mac®
| SIGNIFICANT MARKET POSITION | PASTA |
| CANADA | 1 |
| UNITED STATES | 1 |
| SIGNIFICANT MARKET POSITION | DRY PASTA | FRESH PASTA | SAUCES | FRESH GNOCCHI |
| BELGIUM | 2 | |||
| CZECH REPUBLIC | 1 | 1 | ||
| ESTONIA | 1 | |||
| FRANCE | 1 | 1 | 1 | 1 |
| ROMANIA | 5 | 1 |
AFRICA
Angola
Panzani®
Cameroon
Panzani®
Congo
Panzani®
Gabón
Panzani®
Ivory Coast
Panzani®
Libya
Panzani®
Morocco
Panzani®
Senegal
Panzani®
ASIA
Bahrain
Ronzoni®
Indonesia
Ronzoni®
San Giorgio®
Israel
No Yolks®
Wacky Mac®
Jordan
Ronzoni®
Korea
Ronzoni®
San Giorgio®
Kuwait
Ronzoni®
Malaysia
Ronzoni®
San Giorgio®
Qatar
Panzani®
Saudi Arabia
Panzani®
Ronzoni®
San Giorgio®
United Arab Emirates
Panzani®
Yemen
Panzani®
| SIGNIFICANT MARKET POSITION | PASTA SECA | SALSAS |
| ANTILLES | 1* | 1 |
| CAMEROON | 3* | |
| CONGO | 1* | |
| GABON | 1* | |
| IVORY COAST | 1* | |
| KUWAIT | 4* | |
| LEBANON | 2* | |
| MAURITIUS | 1* | |
| MOROCCO | 2* | |
| QATAR | 3* | |
| SENEGAL | 1* | |
| SAUDI ARABIA | 3* | |
| UNITED ARAB EMIRATES | 3* | |
| *Imported | ||

EBITDA DISTRIBUTION BY BUSINESS UNITS (%)
SALES BY BUSINESS UNITS (%)
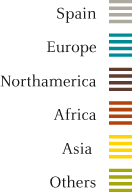
EBITDA DISTRIBUTION BY GEOGRAPHICAL AREAS (%)
SALES BY GEOGRAPHICAL AREAS (%)
| CONSOLIDATED FIGURES | 2011 | 2012 | 2012-2011 | 2013 | 2013-2012 | CAGR 2013-2011 |
|---|---|---|---|---|---|---|
| Net turnover | 1,736,686 | 1,981,130 | 14.1% | 1,956,647 | (1.2%) | 6.1% |
| EBITDA | 273,642 | 299,226 | 9.3% | 282,392 | (5.6%) | 1.6% |
| EBIT | 226,914 | 244,319 | 7.7% | 226,356 | (7.4%) | (0.1%) |
| Operating profit | 229,929 | 255,575 | 11.2% | 212,907 | (16.7%) | (3.8%) |
| Consolidated earnings (Continuing operations) | 166,666 | 160,974 | (0.4%) | 141,489 | (12.1%) | (6.4%) |
| Net earnings on discontinued operations | (10,023) | (2,523) | (1%) | (7,507) | 197.5% | (13.5%) |
| Net profit | 151,542 | 158,592 | 4.7% | 132,759 | (16.3%) | (6.4%) |
| Average current assets | 315,694 | 402,403 | (27.5%) | 420,517 | (4.5%) | |
| Capital employed | 1,007,686 | 1,212,424 | (20.3%) | 1,286,515 | (6.1%) | |
| ROCE (1) | 22.2 | 20.0 | 17.7 | |||
| Capex (2) | 66,596 | 52,930 | (20.5%) | 61,308 | 15.8% | |
| Average headcount | 4,743 | 4,741 | 0.0% | 4,665 | (1.6%) | |
| >> Thousand of euro | ||||||
| (1) ROCE = Operating income CAGR last 12 months / (intangible assets - property, plant & equipment - current assets)) | ||||||
| (2) Capex as cash out flow from investing activities | ||||||
| STOCK MARKET HIGHLIGHTS | 2011 | 2012 | 2012-2011 | 2013 | 2013-2012 | |
|---|---|---|---|---|---|---|
| Number of shares | 153,865,392 | 153,865,392 | 0.0% | 153,865,392 | 0.0% | |
| Market capitalisation at year-end | 2,207,968 | 2,307,981 | 4.5% | 2,621,097 | 13.6% | |
| EPS | 0.98 | 1.03 | 4.7% | 0.86 | (16.3%) | |
| Dividend per share | 0.87 | 0.63 | (27.6%) | 0.60 | (4.8%) | |
| Theoretical book value per share | 10.32 | 11.00 | 6.6% | 11.09 | 0.8% |
| 2011 | 2012 | 2012-2011 | 2013 | 2013-2012 | ||
|---|---|---|---|---|---|---|
| Equity | 1,587,298 | 1,692,209 | (6.6%) | 1,705,757 | 0.8% | |
| Net Debt | 390,073 | 244,804 | 37.2% | 338,291 | (38.2%) | |
| Average Debt | 139,157 | 294,114 | 260,820 | |||
| Leverage (3) | 0.09 | 0.17 | 0.15 | |||
| Total Assets | 2,710,608 | 2,731,812 | 0.8% | 2,772,680 | 1.5% | |
| (3) Ratio of average net financial debt with cost to equity (excluding minority interests) | ||||||
| RICE BUSINESS | 2011 | 2012 | 2012-2011 | 2013 | 2013-2012 | CAGR 2013-2011 |
|---|---|---|---|---|---|---|
| Net turnover | 920,752 | 1,105,738 | 20.1% | 1,090,459 | (1.4%) | 8.8% |
| EBITDA | 135,953 | 161,035 | 18.4% | 137,627 | (14.5%) | 0.6% |
| EBIT | 113,698 | 133,927 | 17.8% | 110,156 | (17.7%) | (1.6%) |
| Operating profit | 103,056 | 103,021 | 26.2% | 102,785 | (20.9%) | (0.1%) |
| Average current assets | 231,686 | 298,822 | (29.0%) | 329,938 | (10.4%) | |
| Capital employed | 582,158 | 729,320 | (25.3%) | 751,292 | (3.0%) | |
| ROCE | ||||||
| Capex | 26,950 | 19,105 | (29.1%) | 21,186 | 10.9% | |
| >> Thousand of euro | ||||||
| PASTA BUSINESS | 2011 | 2012 | 2012-2011 | 2013 | 2013-2012 | CAGR 2013-2011 |
|---|---|---|---|---|---|---|
| Net turnover | 860,872 | 920,693 | 6.9% | 915,120 | (0.6%) | 3.1% |
| EBITDA | 144,993 | 145,246 | 0.2% | 152,955 | (5.3%) | 2.7% |
| EBIT | 121,956 | 118,884 | (2.5%) | 125,725 | 5.8% | 1.5% |
| Operating profit | 118,653 | 110,185 | (7.1%) | 115,283 | 4.6% | (1.4%) |
| Average current assets | 69,173 | 90,115 | (30.3%) | 76,369 | 15.3% | |
| Capital employed | 456,917 | 520,948 | (14.0%) | 508,429 | 2.4% | |
| ROCE | 26.7 | 22.4 | 25.7 | |||
| Capex | 37,093 | 33,040 | (10.9%) | 38,720 | 17,2% | |
| >> Thousand of euro | ||||||