

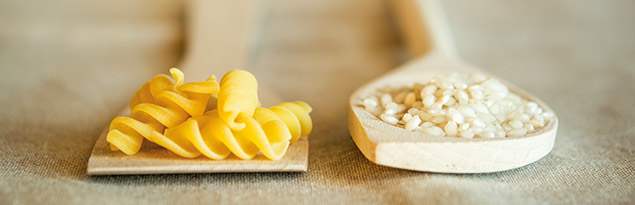
Distribution of Sales and EBITDA
by business areas
EBITDA BY BUSINESS LINES
53%
47%
48%
52%
50%
50%

SALES BY BUSINESS LINES
55%
45%
55%
45%
54%
46%
Distribution of Sales and EBITDA
by geographical areas
EBITDA BY GEOGRAPHICAL AREAS


SALES BY GEOGRAPHICAL AREAS


Ebro Foods in figures
| CONSOLIDATED FIGURES | 2012 | 2013 | 2013-2012 | 2014 | 2014-2013 | CAGR 2014-2012 |
|---|---|---|---|---|---|---|
| Net turnover | 1,981,130 | 1,956,647 | (1.2%) | 2,120,722 | 8.4% | 3.5% |
| EBITDA | 299,226 | 282,392 | (5.6%) | 287,251 | 1.7% | (2.0%) |
| EBIT | 244,319 | 226,356 | (7.4%) | 227,242 | 0.4% | (3.6%) |
| Operating profit | 255,575 | 212,907 | (16.7%) | 217,377 | 2.1% | (7.8%) |
| Consolidated earnings (Continuing operations) | 160,974 | 141,489 | (12.1%) | 151,342 | 7.0% | (3.0%) |
| Net earnings on discontinued operations | (2,523) | (7,507) | 2 | (2,223) | (70.4%) | (6.1%) |
| Net profit | 158,592 | 132,759 | (16.3%) | 146,013 | 10.0% | (4.0%) |
| Average working capital | 402,403 | 420,517 | (4.5%) | 442,036 | (5.1%) | |
| Capital employed | 1,212,424 | 1,286,515 | (6.1%) | 1,363,346 | (6.0%) | |
| ROCE (1) | 20.0 | 17.7 | 16.7 | |||
| Capex (2) | 52,930 | 61,308 | 15.8% | 67,123 | 9.5% | |
| Average headcount | 4,741 | 4,665 | (1.6%) | 5,189 | 11.2% | |
| Thousand of euros | ||||||
| STOCK MARKET HIGHLIGHTS | 2012 | 2013 | 2013-2012 | 2014 | 2014-2013 | |
|---|---|---|---|---|---|---|
| Number of shares | 153,865,392 | 153,865,392 | 0.0% | 153,865,392 | 0.0% | |
| Market capitalisation at year-end | 2,307,981 | 2,621,097 | 13.6% | 2,109,495 | (19.5%) | |
| EPS | 1.03 | 0.86 | (16.3%) | 0.95 | 10.0% | |
| Dividend per share | 0.63 | 0.60 | (4.8%) | 0.50 | (16.7%) | |
| Theoretical book value per share | 11.00 | 11.09 | 0.8% | 12.02 | 8.4% |
| 2012 | 2013 | 2013-2012 | 2014 | 2014-2013 | ||
|---|---|---|---|---|---|---|
| Equity | 1,692,209 | 1,705,757 | 0.8% | 1,849,485 | 8.4% | |
| Net Debt | 244,804 | 338,291 | (38.2%) | 405,617 | (19.9%) | |
| Average Debt | 294,114 | 260,820 | 333,178 | |||
| Leverage (3) | 0.17 | 0.15 | 0.18 | |||
| Total Assets | 2,731,812 | 2,772,680 | 1.5% | 3,162,068 | 14.0% | |
| (1) ROCE = (Operating income CAGR last 12 months / (intangible assets - property, plant & equipment - working capital) | ||||||
| (2) Capex as cash outflow from investing activities | ||||||
| (3) Ratio of average net financial debt with cost to equity (excluding minority interests) | ||||||
| RICE BUSINESS | 2012 | 2013 | 2013-2012 | 2014 | 2014-2013 | CAGR 2014-2012 |
|---|---|---|---|---|---|---|
| Net turnover | 1,105,738 | 1,090,459 | (1.4%) | 1,139,697 | 4.5% | 1.5% |
| EBITDA | 161,035 | 137,627 | (14.5%) | 148,828 | 8.1% | (3.9%) |
| EBIT | 133,927 | 110,156 | (17.7%) | 121,789 | 10.6% | (4.6%) |
| Operating profit | 103,021 | 102,785 | (20.9%) | 118,439 | 15.2% | (4.6%) |
| Average current assets | 298,822 | 329,938 | (10.4%) | 339,882 | (3.0%) | |
| Capital employed | 729,320 | 751,292 | (3.0%) | 767,771 | (2.2%) | |
| ROCE | ||||||
| Capex | 19,105 | 21,186 | 10.9% | 32,440 | 53.1% | |
| Thousand of euros | ||||||
| PASTA BUSINESS | 2012 | 2013 | 2013-2012 | 2014 | 2014-2013 | CAGR 2014-2012 |
|---|---|---|---|---|---|---|
| Net turnover | 914,783 | 915,120 | 0.0% | 1,029,294 | 12.5% | 6.1% |
| EBITDA | 146,132 | 152,955 | 4.7% | 146,317 | (4.3%) | 0.1% |
| EBIT | 118,884 | 125,725 | 5.8% | 114,397 | (9.0%) | (1.9%) |
| Operating profit | 110,185 | 115,283 | 4.6% | 112,340 | (2.6%) | 1.0% |
| Average current assets | 90,115 | 76,369 | 15.3% | 94,810 | (24.1%) | |
| Capital employed | 520,948 | 508,429 | 2.4% | 578,767 | (13.8%) | |
| ROCE | 22.4 | 25.7 | 20.5 | |||
| Capex | 33,040 | 38,720 | 17.2% | 34,249 | (11.5%) | |
| Thousand of euros | ||||||